
Increasingly, thought leaders and executives within the automotive industry have shared their concerns about the validity of miles and disengagements as metrics for safe deployment of autonomous vehicles, and some have started proposing alternative metrics. Early in my career, I worked on a very interesting project at Intel, the project group designed the Pentium-pro microprocessor. At the time, this was the most complicated design ever attempted by Intel, and most likely anywhere else. To ensure the quality of this complex beast, we had to develop a new methodology and make sure we got it right. Choosing to measure the number of programs executed or bug rate would have made measuring ‘easy’, but not very meaningful. Instead, we came up with novel meaningful metrics that measured the functionality tested and the complex interactions of events.
Last week, the California Department of Motor Vehicles released the 2019 disengagement report, containing information reported by companies piloting self-driving vehicles in the state.
The Autonomous industry is struggling for effective metrics for safe deployment of AVs. The ‘easiest’ metrics available to the AV industry are the number of miles driven by the AV and the number of disengagements. However, these indicators, while ‘easy’ to measure, are not sufficient as a measure for AV safety.
The recent release of the state of California’s Disengagement report
Increasingly, thought leaders and executives within the automotive industry have shared their concerns about the validity of miles and disengagements as metrics for safe deployment of autonomous vehicles, and some have started proposing alternative metrics.
Kyle Vogt of Cruise writes in an article titled “The Disengagement Myth” that it is frequently unclear if a disengagement reflects real safety issues or more of the disengagement policy of the AV developer. He asserts that the number of disengagements per mile alone does not reflect the readiness of the vehicle for fully autonomous driving.
Oliver Cameron of Voyage is speaking about the lack of standardization of what constitutes a disengagement and is proposing an alternative Driver Readiness Score as a new way for companies to publicly share their progress. This proposed score includes the percentage of scenarios passing in simulation.
Chris Urmson of Aurora asks in a recent article “If we drive 100 million miles in a flat, dry area where there are no other vehicles or people, and few intersections, is our “disengagement rate” really comparable to driving 100 miles in a busy and complex city like Pittsburgh?”. Urmson points out that just measuring the number of miles driven can be a deceptive indication of progress.
I would put it more bluntly: many of these miles are “dumb miles” — miles that add nothing new to the testing. For example how many of these were just driving on a straight empty highway? How many times did the AV encounter a cut-in from the right side? Did the AV encounter a cut-in on a curved highway in light rain?
So what are effective metrics the AV industry can be using?
Effective metrics are needed for tracking how close we are to achieving our safety goals, and where we should focus additional effort. The metrics should answer in an objective, quantifiable way: Do we know what scenarios and parameters were encountered during the testing? Were the safety requirements met? Were key performance indicators (KPIs) met? How many miles were driven using the latest release of the software and not using older irrelevant versions?
Disengagements and miles driven, while showing general progress, are insufficient at proving the safety goals. To fill in the gaps, it’s essential to look inside the miles — make sure we successfully exercise the scenarios critical for AV safety and provide the required metrics to prove it.
How can we do that?
An alternative approach for both creating and tracking effective metrics of AV safety is the Coverage Driven Verification (CDV) approach.
CDV originated in the semiconductor industry, where it has been widely used for many years. In recent years, we adapted the approach for safety-verification of AVs. It provides a methodical way to specify scenarios and mixed scenarios required for achieving an objective metric for the completeness of safety requirements.
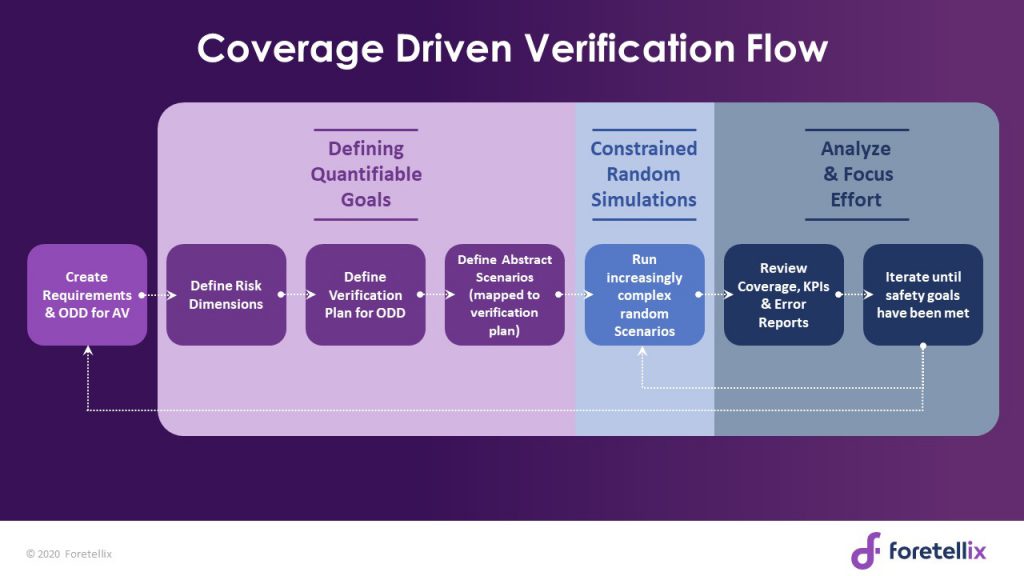
In utilizing our approach, first, high-level requirements including the operational design domain (ODD) are defined. A comprehensive list of risk dimensions is written based on the requirements. Using the risk dimensions, a comprehensive verification plan is created. The plan includes quantifiable, measurable goals down to the parameter level including both coverage metrics and KPIs. The next step is to define the high-level abstract scenarios and their parameters using a scenario description language. The combinations of the parameters in an abstract scenario create a plethora of concrete scenarios to be tested.
The concrete scenarios are run across different testing platforms, including simulators, hardware-in-the-loop, test tracks, and street driving, and produce meaningful metrics which are aggregated into a comprehensive coverage and KPI report. Analysis of the report drives the verification effort to hone in on non-covered areas, while intense constraints-based random test generation is used to complete the coverage holes and to explore areas beyond the known scenarios to assure the highest level of safety.
Example of defined coverage
For example two of the risk dimensions defined could be vehicle maneuvers and weather. A vehicle maneuver abstract scenario can be a cut-in scenario, the coverage defined includes various parameters such as speed of the EGO, distance at start of cut-in, side of cut-in. KPIs recorded can be TTC (time to collision), deceleration rate etc. The cut-in scenarios can be mixed for weather scenarios from sunny weather, through drizzle to heavy rain and along with any other weather condition defined in the AV’s ODD.
The Disengagement report and surrounding discussions highlight the AV industry’s need for meaningful metrics which are objective, quantifiable and encompass the safety requirements of AVs. The Coverage Driven Verification approach provides a clear framework and method to define and track meaningful metrics. It is my belief that adoption of this systematic approach will help the industry achieve safe deployment of AVs sooner.

")

