This is the second blog in a series. In the first blog (Accelerating Automated Driving System Deployment with Scalable, Data-Driven Evaluation), Mike Stellfox pointed out that the real challenge in AV development has shifted from simply building systems to ensuring we can truly trust them.
In the quest to build trust in self-driving safety, it’s not about how far you drive, but what you find along the way and how completely you understand scenario coverage. Logging billions of uneventful miles is inefficient for proving safety and reliability because it contributes little to meaningful scenario coverage. A far more powerful method is to actively find and analyze the rare, safety-critical events that truly matter for the safety and performance of an Automated Driving System (ADS), dramatically improving scenario coverage.
This article explores a methodology for automated scenario curation, the process of identifying and extracting the most valuable, safety-critical scenarios from massive sets of real-world and simulated drive logs in order to strengthen scenario coverage. By focusing on these meaningful slices of data, we can efficiently and effectively evaluate a system’s true capabilities and directly advance scenario coverage. This shift from quantity to quality in data analysis is crucial for ensuring that autonomous vehicles are thoroughly tested in the very conditions that pose the greatest risk, ultimately building confidence in their deployment.
Beyond simply finding interesting events, efficient scenario curation is critical for establishing the absence of unreasonable risk. By identifying, extracting, and validating the specific scenarios that pose a genuine risk for the ADS, this process is the foundational layer for both verification and validation (V&V) and AI training workflows. For V&V, it helps pinpoint the root causes of unexpected behavior and streamlines debugging. For training, it enables mining and assembling datasets that represent crucial edge cases, anomalies, and underrepresented conditions, significantly boosting model robustness and an ADS’s ability to handle the unexpected.
The automated approach enabled by the Foretify Evaluation solution allows engineers to tackle three critical tasks:
- Finding and analyzing real-world edge cases to build a diverse and representative dataset of scenarios essential for both training and validation
- Objectively measuring testing or training coverage within a given Operational Design Domain (ODD), proving that the ADS has been exposed to a wide variety of relevant situations.
- Identifying ODD gaps to provide quantitative insights into micro-ODDs that the ADS has not yet been exposed to. This transforms raw data into actionable intelligence, significantly accelerating the path to a safer ADS.
Finally, by focusing on these valuable, data-driven insights:
- Engineers and Engineering Leaders can prioritize development around the situations proven to cause system uncertainty or failure in the real world.
- ADS Safety Assurance Teams can clearly quantify risks and define mitigation methods for development and deployment teams.
- Deployment teams can apply appropriate constraints to ensure the ADS operates only within the safe subset of its target operational domain (TOD).
Key Challenges in Scenario Curation
Scenario curation is essential for building robust test suites, supporting debugging and root cause analysis, and training AI models. Despite its importance, several challenges can limit its effectiveness:
- Manual scenario curation is time-consuming and labor-intensive, and repeating the process across multiple Autonomous Vehicle (AV) stack revisions is not scalable.
- Real-world driving logs often contain significant noise due to imperfect perception or uninteresting driving behavior, creating the challenge of building a robust pipeline to turn noisy driving data into a curated set of diverse, high-value scenarios without losing rare edge cases.
- Non-standard simulation formats require adaptation before curation, increasing manual effort and the risk of data inconsistency.
- Ensuring that curated scenarios comprehensively cover risky, rare, and safety-critical events is difficult. Addressing this requires massive, heterogeneous datasets from diverse sources, including simulations, real-world logs, and test tracks, along with automated and scalable processing methods.
End-to-end Evaluation Pipeline
A truly scalable solution must address the challenges above through automation and abstraction. The Foretify Evaluate solution provides a complete reference implementation for such an end-to-end pipeline, integrating modular utilities that standardize drive log analysis and enable reusable scenario content across ODDs.
This standardized workflow eliminates manual bottlenecks by automating data preparation, scenario matching, and downstream analysis. It unifies heterogeneous datasets from both simulation and real-world testing into a single, repeatable framework for data-driven evaluation.
Each stage builds on the previous one to deliver complete, automated scenario evaluation at scale. The pipeline leverages cloud-compute infrastructure for parallelized ingestion and matching, and integrates easily into CI/CD workflows, ensuring that data-driven evaluation happens continuously, not sporadically.
Pipeline Stages
The diagram below illustrates how the pipeline operates as a sequential flow of six main stages:
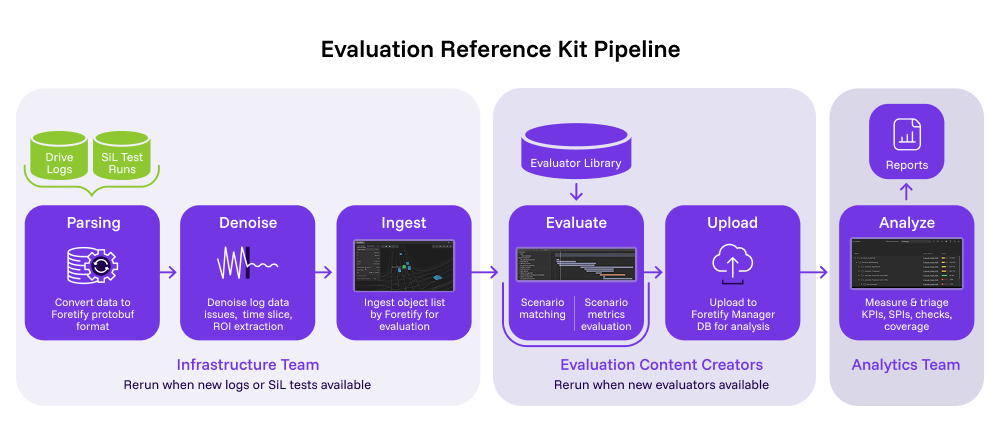
- Data Preparation
- Parsing: Converts raw input log data captured in proprietary formats to structured object lists, ready for downstream processing.
- Time Slicing & Organization: Infrastructure teams typically organize logs by vehicle, date, or run, to facilitate bulk processing and tracing.
- Preprocessing
- Denoising: Removes perception artifacts, ghost objects, jitter, and inconsistent parameter values using configurable denoiser algorithms,ensuring clean input for scenario matching and coverage/KPI analysis. These can be customized and extended as needed to match specific datasets
- ROI (Region of Interest) Generation: Optionally extracts regions of interest within a map from log data to focus scenario matching and analysis only on relevant locations.
- Ingestion
- Imports object lists, map configurations, and denoised log data into the Foretify evaluation environment. This acts as the ground truth for scenario analysis.
- Matching
- Uses scenario libraries defined in OSC DSL to scan ingested data and extract intervals where specific scenarios (e.g., vehicle cut-in, pedestrian crossing) occur. Matching leverages parameterized scenario definitions for flexibility. In the context of the matched scenario coverage, Key Performance Indicator (KPI) metrics are gathered, and checks are evaluated.
- Analysis
- Uploads the results of scenario matching (intervals, metrics) to Foretify Manager for interactive review, coverage calculation, triage, and further analysis. This includes metrics like min_ttc, ego speed, and scenario coverage grades.
Summary Table: Evaluation Pipeline Stages & Solved Problems
| Stage | Purpose | Problem Solved |
| Parse | Convert raw logs to object lists | Standardizes input data; prepping for pipeline |
| Denoise | Clean log data; remove artifacts | Increases data fidelity; enables reliable matching |
| ROI. | Focus on regions of interest | Speeds up matching; shrinks search space |
| Ingest | Import processed data | Integrates into the evaluation environment |
| Match | Scenario extraction and metrics | Enables high-fidelity coverage and triage |
| Analysis | Review results | Centralizes findings; enables further model evaluation |
Examples of End-to-End Evaluation in ActionTo demonstrate the full evaluation pipeline, Foretellix used datasets from open-source driving logs such as PandaSet, a high-quality, open-source dataset for autonomous driving research and development, created in collaboration between Hesai and Scale AI.
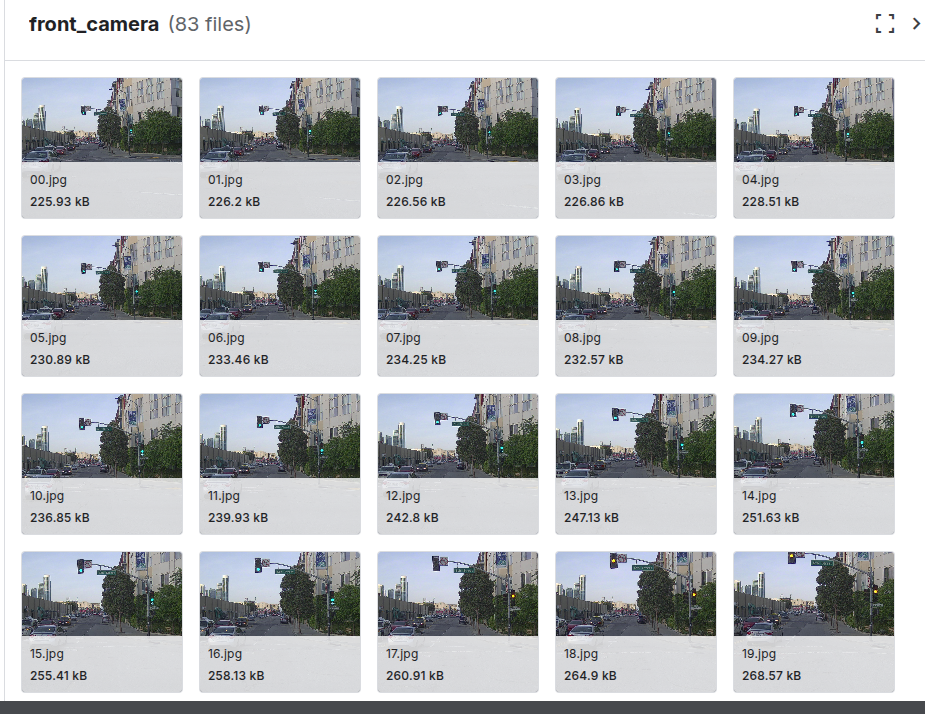
PandaSet features comprehensive data collected from a vehicle-mounted sensor suite and is meticulously annotated with 3D bounding boxes for 28 object classes and 37 semantic segmentation labels. These annotations are essential for training machine learning models in tasks such as object detection and scene understanding. The dataset contains over 100 scenes depicting complex urban driving scenarios, including dense traffic, construction zones, and varying lighting conditions in Silicon Valley.
To evaluate this dataset using the evaluation pipeline described above, we first had to convert the source drive logs to object lists and align them with high-quality maps. Once maps are made available, the end-to-end evaluation pipeline was run like this:
./run_eval.sh --config config/suburban_pandaset.yaml
Each independent step and its dependencies were resolved automatically by the evaluation pipeline execution manager, producing detailed log outputs:
[2025-09-05 11:19:26] Running evaluation with configuration file: config/suburban_pandaset.yaml
[2025-09-05 11:19:26] Sourcing config file: /tmp/results/ref_kit/config/eval_config.bash
[2025-09-05 11:19:26] Detailed logs can be found here: LOG: /tmp/results/ref_kit/logs/ref_kit_commands_20250905_111926.log
[2025-09-05 11:19:26] Tasks to be executed: roi ingest match post_match
[2025-09-05 11:19:26] Task 1: Generating ROI for object list directory: drive_logs//object_lists/suburban_odd/pandaset
[2025-09-05 11:19:30] ✓ ROI generation completed
[2025-09-05 11:19:30] Task 2: Running ingestion on object list directory /tmp/results/ref_kit/roi
[2025-09-05 11:20:42] ✓ Ingestion completed, ingested runs are here /tmp/results/ref_kit/ingestion
[2025-09-05 11:20:42] Task 3: Running matching on ingestion results /tmp/results/ref_kit/ingestion
[2025-09-05 11:20:51] ✓ Matching compilation completed, compiled directory is here /tmp/results/ref_kit/matching
[2025-09-05 11:21:11] ✓ Matching completed, matched runs are here /tmp/results/ref_kit/matches
At this point, the run results database is ready for both macro-level and micro-level analysis:
- Macro-level analysis gathers data across all drive logs and finds occurrences of scenarios defined in the evaluation scenario library, e.g., lead_vehicle, cut_in, etc…
- Micro-level analysis allows close inspection of individual events, such as shows a lead-vehicle scenario in a junction when a pedestrian is crossing the street.
Foretify’s Python SDK enables further programmatic analysis, letting users fetch, analyze, and curate these scenarios at a massive scale with high efficiency.
Scenario Matching Example
Below is an example of an OSC2.0 DSL code segment used to query drive logs to find matches:
match:
    lead_vehicle: sut.lead_vehicle(min_distance_from_sut_in_time_units: 0s, max_distance_from_sut_in_time_units: 5s,
                         min_lead_part_phase_duration: 2s, max_ref_car_driving_phase_duration: 2s,
                         lead_vehicle_min_moving_speed: 1kph, lane_calculation_tolerance_length: 1m,
                         kinds: [vehicle, cyclist, truck, emergency_vehicle, bus, motorcycle])
    follower_vehicle: sut.follower_vehicle(min_distance_from_sut_in_time_units: 0s, max_distance_from_sut_in_time_units: 5s,
                             lane_calculation_tolerance_length: 1m,
                             kinds: [vehicle, cyclist, truck, emergency_vehicle, bus, motorcycle])
    sut_junction_traversal: sut.sut_junction_traversal()
The evaluation scenario library provides a fast starting point while allowing customization to meet specific ODD requirements
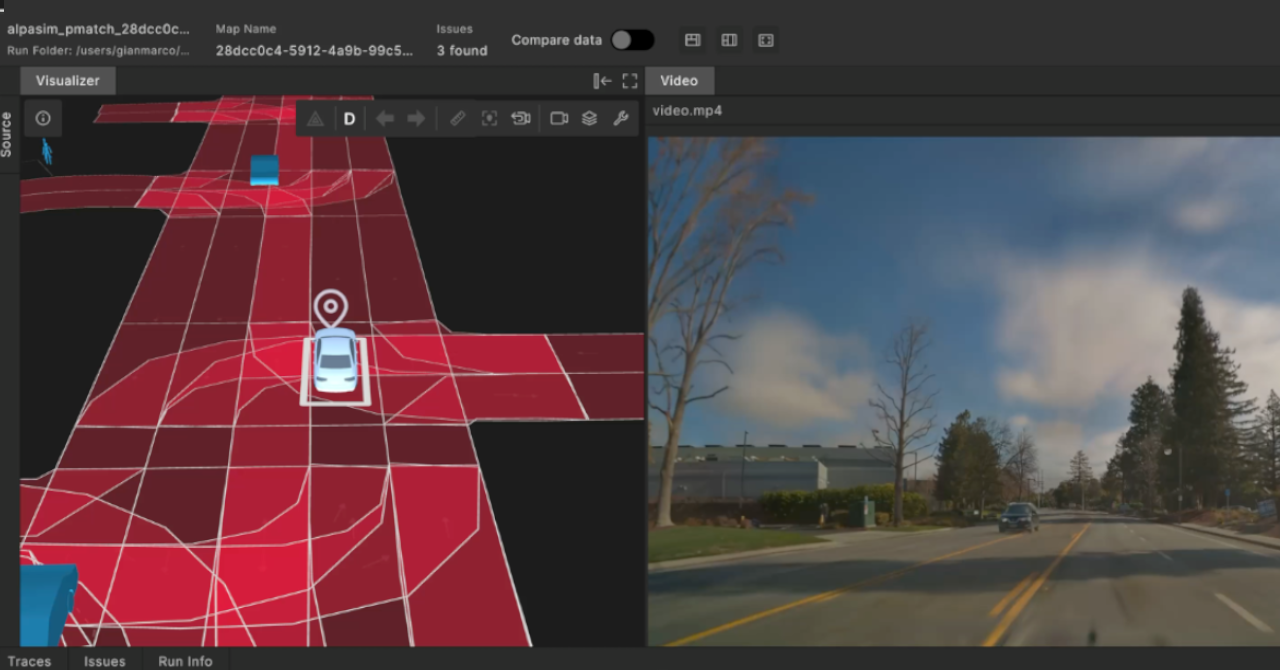
The left-hand screen in the example below shows an object-level representation of a drive log snippet from a suburban San Francisco map. This ingested view, available right after the ingestion stage,is good for measuring and querying parameters of the scene.
When a scenario match occurs, this annotated view shows the match intervals in the scene with timing markers and associated parameters:
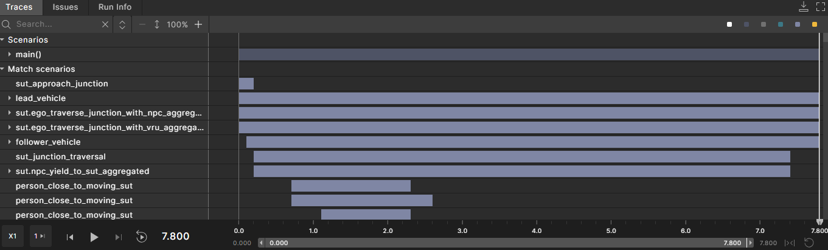
Scenarios discovered in this scene include:
- Lead Vehicle
- Traverse Junction with Person
- Traverse Junction with Other Vehicles
- The Ego Yields to Another Vehicle
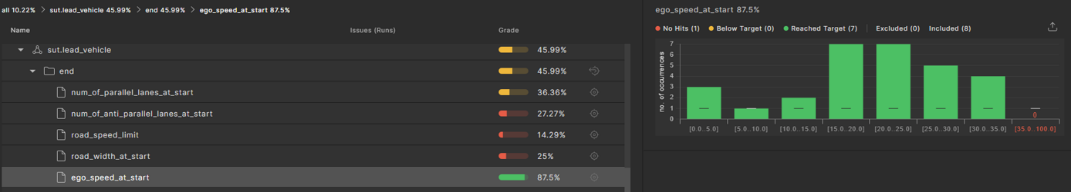
This timestamped interval view enables Developers and V&V engineers to identify the root cause of the Ego’s response to a particular scenario.To achieve reliable, data-driven evaluation, analysis at scale is essential. Evaluating thousands of drive logs requires programmatic tools to extract insights efficiently, a capability built directly into the Foretify Evaluate environment.For every matched scenario, coverage metrics are collected on relevant parameters to measure how thoroughly the Ego has been tested within that scenario context. For example, the coverage analysis view below shows ego vehicle’s speed at the start of the lead_vehicle scenario, aggregated across multiple evaluated drive logs.At-Scale Analysis Using the Foretify Python SDK
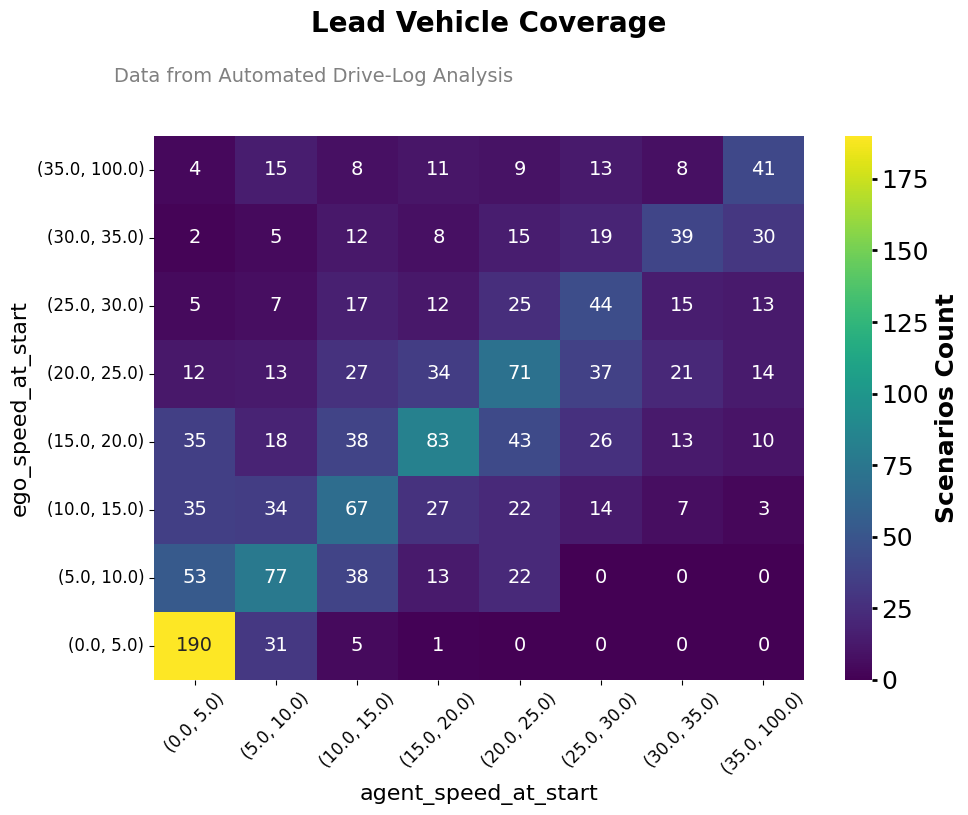
The example below demonstrates an aggregated heat map of lead vehicle scenario parameters across thousands of highway drive logs. Generated using the Foretify Manager Python SDK, it visualizes the distribution of lead-vehicle scenarios based on the speeds of both the ego vehicle and the agent (lead_vehicle). The analysis clearly shows that the overwhelming majority of observed data points fall within the lowest speed bins (0−10 mph), with a distinct peak of 190 instances in the (0.0, 5.0) mph ego speed range and the (0.0, 5.0) mph lead_vehicle speed range. Conversely, coverage decreases significantly in the upper speed ranges (particularly above 30 mph) where counts rarely exceed 15 and often drop to zero.
The SDK simplifies the fetching and analysis of coverage and KPI metrics at scale. For example, a user could easily extract data from multiple runs by making a call like this:
intervals_df = fmapi.extract_intervals_from_tsr_df(tsr_df=runs)
| scenario_name | start_time | end_time |
| ego_traverse_junction_with_npc | 29.46 | 29.56 |
| ego_traverse_junction_with_npc | 27.4 | 29.56 |
| ego_traverse_junction_with_npc | 13.92 | 16.34 |
| ego_traverse_junction_with_npc | 13.88 | 16.34 |
| ego_traverse_junction_with_npc | 11.94 | 16.34 |
| sut_junction_traversal | 28.02 | 29.56 |
| sut_junction_traversal | 12.12 | 16.02 |
| follower_vehicle | 26.02 | 29.46 |
| follower_vehicle | 0.04 | 26.02 |
| follower_vehicle | 0.04 | 14.24 |
| sut_approach_junction | 25.1 | 28.02 |
| sut_approach_junction | 9.28 | 12.12 |
| lead_vehicle | 14.4 | 28.34 |
| lead_vehicle | 0.02 | 6.56 |
| adjacent_ahead_taller_vehicle | 13.32 | 15.04 |
| adjacent_ahead_taller_vehicle | 10.04 | 12.66 |
| adjacent_ahead_taller_vehicle | 0.04 | 10.04 |
Because this data is fetched in a programmatic view, users can add custom filters and metadata – for example, linking runs to the Foretify Visualizer, filtering out shortruns t, excluding junction crossings with large pedestrian crowds (not just 1-2 people), etc. This flexibility enables automatic clustering and triage across thousands of runs, with the results available for immediate further analysis.
Automated At-Scale Scenario Curation
Detailed analysis of labeled data can also help identify interesting scenarios for training datasets, ensuring diversity that reflects both rare, safety-critical scenarios and real-world behavior.
By matching scenarios and their parameters (scenario instances) to intervals using OSC DSL, only the relevant portions of drive logs are included in the training set. This avoids bloating the dataset with uninformative “background” frames and focuses learning on critical interactions (e.g., vehicle cut-ins, near-collisions). Narrowing down “where to look” within vast datasets shortens time-to-resolution for complex issues, accelerating triage and root-cause analysis during development, deployment, and post-deployment It also enables the creation of scenario variants, amplifying or modifying real-world cases to strengthen AI model performance.
Features like coverage measurement and compound filters help ensure that a diverse range of scenarios—including edge cases and rare events—are systematically represented in the training dataset. This diversity is vital for improving the performance of the AI driving stack under both common and uncommon conditions. One of the most effective ways to address bias in training algorithms is to ensure knowledge-driven data diversity in training data.
Key Takeaways
- Scenario curation is fundamental to ensuring the safety and performance of the ADS.
- Scalable, automated curation of large heterogeneous drive logs requires an end-to-end, platform-agnostic evaluation pipeline.
- OSC2.0 DSL enables the abstract description of evaluation scenarios that can be applied programmatically to large-scale drive logs and simulation test datasets.
- Performing at-scale analysis of drive logs, whether for root-cause analysis or generating training datasets for an AI-based ADS stack requires a sophisticated database that supports seamless SDK and API integration, extending the workflow’s utility across different domains.
- Together, these components provide actionable insights for all technical roles involved in ADS validation, training, and decision-making.
Looking Ahead
Stay tuned for additional deep dives in this blog series exploring key components of the Foretify Evaluate Solution and its role in enabling safe, AI-powered autonomy.
References
For a deeper dive on the need for formal abstractions for evaluating AI-based Autonomous Driving Systems, check out this recent blog post from Yoav Hollander, the CTO at Foretellix.

You might also like

Why High-Fidelity Sensor Simulation is Critical for Physical AI Development and Testing
Autonomous vehicles (AVs) must safely navigate complex and unpredictable environments. Yet even the most advanced perception systems face limitations when…

Streamlining AI-Driven Map Construction from Vehicle Perception Data
The autonomous vehicle industry is undergoing a transition from high-definition maps toward real-time perception-based navigation. This shift raises a critical…
Using AI to Bridge the Gap Between NCAP Compliance and Real-World Safety
Foretellix is bridging the gap between NCAP tests and AI driving stacks performing predictably and safely.